THE SOFTWARE IS PROVIDED "AS IS", WITHOUT WARRANTY OF ANY KIND, EXPRESS OR IMPLIED, INCLUDING BUT NOT LIMITED TO THE WARRANTIES OF MERCHANTABILITY, FITNESS FOR A PARTICULAR PURPOSE, TITLE AND NON-INFRINGEMENT. IN NO EVENT SHALL THE COPYRIGHT HOLDERS OR ANYONE DISTRIBUTING THE SOFTWARE BE LIABLE FOR ANY DAMAGES OR OTHER LIABILITY, WHETHER IN CONTRACT, TORT OR OTHERWISE, ARISING FROM, OUT OF OR IN CONNECTION WITH THE SOFTWARE OR THE USE OR OTHER DEALINGS IN THE SOFTWARE.
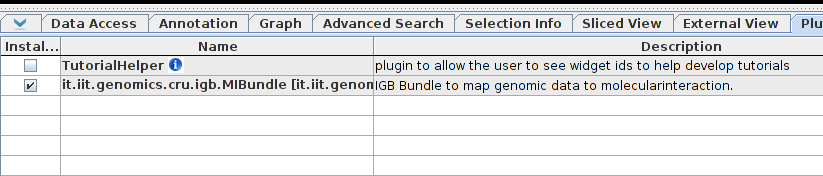
Loading the MI Bundle plugin.
In order to use the MI Bundle, run IGB, go the the plugin tab, click on the "repositories..." button and add the repository "http://cru.genomics.iit.it/igb/plugins/".
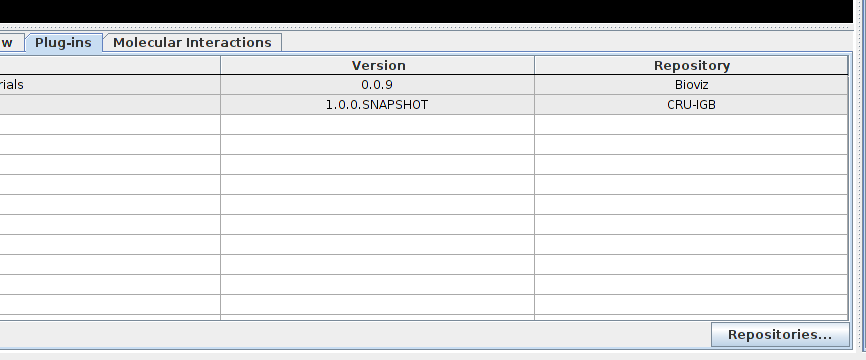
The plugin should now appear in the list, select the check box to install it.
The search panel.
Search type
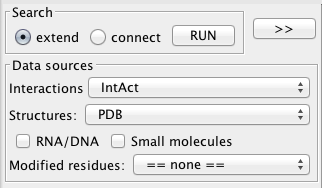
Two type of search are possible. The first one, named extend search, will look for partners of the product of the selected genes in protein interaction databases. The second, connect search, will look for interactions between the products of selected genes. While the first one is intended for who's looking for a relationship between its selection and any other gene, the goal of the second one is to characterize the relationship between a given set of genes.
Molecular Interaction provider
At startup, the plugin queries the psicquic registry to retrieve a list of protein interaction providers It is therefore possible to query either the major high quality literature curation databases like MINT, Intact and DIP, one of the metadatabases that merge data from other repositories like iRefIndex, or additional resources like STRING which includes predictions of protein associations or Reactome which contains curated functional associations.
Structure sources
structures and models for both single proteins and interactions are retrieved from PDB and interactome3D. Interactome3D complete the 3D protein interaction network with high confidence models for 9 model organisms (version 2013_06). While interactome3D also permits to submit new interactions in any species, we limit our framework to the precomputed 3D network that can be queried on the fly. For instance, 3216 models of human proteins interactions are added to the 3727 binary interaction structures extracted from PDB (version 2013_06). It is also possible to choose DSysMap, in which case the plugin, rather than calculating the contacts from the structures, will import informations about known pathogenic mutations.
Select regions
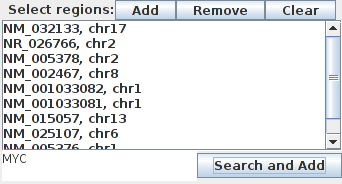
There are three way for selecting a genomic region. The first one consist in selecting a region (that contains one or more genes, mutations etc.) and press the RUN button. In order to do more complex queries (for instance on several chromosomes) or to keep the query for the next search, it is possible to add the selection to to search box.
- Add: add selected regions to the list.
- Remove: remove selected region to the list.
- Clear: remove all regions from the list.
- Add track: add all regions from selected tracks.
- Search and add: perform a text search on all regions. All regions found are added to the list.
Suggested options
- Interaction database: intact includes data from several other databases (for instance MINT, MatrixDb, MPIDB) and ensure a high curation quality and is regularly updated. Try with mentha for additional interactions or Reactome for functional interactions.
- Structure source: Interactome3D includes most of interaction structures from PDB and extends them with models. Use PDB if the interactions found have not been integrated in the pre-calulated interactome3D networks.
The result panel.

The results can be exported in a tab-delimited file. Each row on the file contains information about the interacting proteins, and the selected regions coding for residues that have been found on a structure or at the interface between two proteins. In addition, it is possible to export the table as a protein interaction network in a xgmml format that can be displayed for instance in Cytoscape.
Buttons
 Log: display the log for current query. If an error occurs, the
icon will be display over a red background.
Log: display the log for current query. If an error occurs, the
icon will be display over a red background. Network: display the network as a graph.
 Save (text format): save the results in a tab-delimited file.
 Save (xgmml): save the results in the xgmml format, which may be
loaded in network visualization browsers like Cytoscape.
Save (xgmml): save the results in the xgmml format, which may be
loaded in network visualization browsers like Cytoscape. Jmol: view selected structure in Jmol.
 Link: open the link to the original database in an external browser.
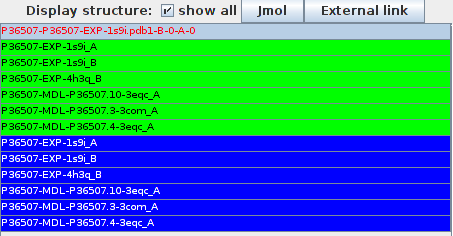
All results are displayed in a clickable table:
- Track: The main track created for each query contains a summary of all regions interacting or in contact for this query. It is possible to press this button to create a track that contains the results for this interaction only. This will help for instance comparing the residues that are in contacts with commons or different molecules.
- Gene: gene or molecule name. Double click on this cell to zoom onto the region associated in the browser.
- Reference: for protein coding genes, its Uniprot Accession. Double click on this cell to open the associated page of the Uniprot website in an external browser. If the molecule is DNA, RNA or small molecule, its formula or a label is displayed and the link forwards to PDB.
- Evidence: See below.
- Diseases: list of diseases associated to the proteins according to Uniprot. The disease name is colored in greenif it is associated to the first protein, in blue if associated to the second protein, and orange if common to both proteins.
- Structures: colored squares are displayed id a structure is available for this interaction. Orange border indicates that a selected residue is mapped on the protein, red border shows that a selected residues is in contact with the other molecule.
Evidences
Each interaction can be supported by several experimental methods. The methods are classified and summarized with the following code:- Structure/model: structure or model imported from a structure database (e.g. PDB or Interactome3D).
- Physical: direct and physical interactions, detected for instance by Yeast 2 Hybrid assays.
- Associations: the molecules have been identified in the same complex, but are not necessarily in direct contact (e.g. tandem affinity purification).
- Enzymatic reactions: such as phosphorylation ubiquitination.
- Other types of interactions including colocalizations and genetic interactions (synthetic lethal).
- Structure/model: structure or model imported from a structure database (e.g. PDB or Interactome3D).
Evidence score
A simple score has been implemented to allow filtering the interactions with the stronger experimental evidence. The score is represented by a number of *.- * all interactions imported from a database (excluding the structure database).
- ** interactions detected by at least two methods OR supported by at least two bibliographic references.
- *** interactions detected by at least two methods AND supported by at least two bibliographic references.
The structure panel.
Structure table
The names of the structures is displayed in orange if a residue selected is mapped on the structure, red it is in contact with the other molecule.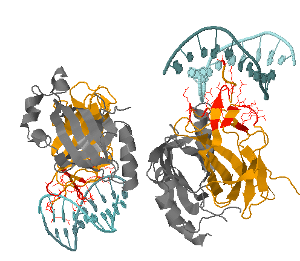
Selecting any of those reference and pressing the Jmol button will open a new Jmol window where the structure is displayed. Different shades of green and blue are used to color the chains associated to the first and second protein (a protein may be present more than once in a structure, for instance for homodimers). The residues selected by the user to perform the search are displayed in orange or red if they are at the interface between two chains. The user can benefit from all the feature of Jmol, including scripting and exporting in an image file.
New tracks in the genome browser:
New tracks are create for each result. The tracks displays either the genes which products are involved in an interactions or the residues found at the interface between a protein and another molecule.
The elements in the new track are represented as red horizontal lines with vertical sticks at the positions that encode for residues at an interaction interface. If no contact residues was found, a black vertical bar is displayed over the region that encode a selected or interacting gene.
The network visualization.
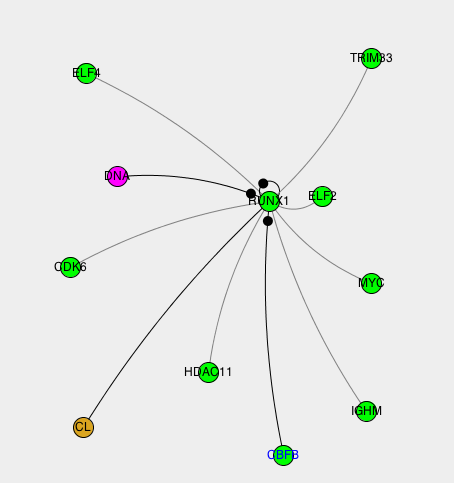 |
The interactions can be displayed in a graphical network. The type of molecule is represented by its color. A small black circle on one side of an edge indicates that contacts have been detected on this side of the interaction. |
Configuration
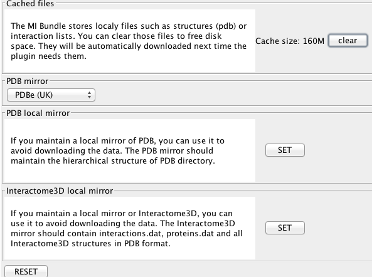 |
File cacheThe MI Bundle stores localy files such as structures (pdb) or interaction lists. You can clear those files to free disk space. They will be automatically downloaded next time the plugin needs them. PDB local mirrorIf you maintain a local mirror of PDB, you can use it to avoid downloading the data. The PDB mirror should maintain the hierarchical structure of PDB directory. Interactome3D local mirrorIf you maintain a local mirror or Interactome3D, you can use it to avoid downloading the data. The Interactome3D mirror should contain interactions.dat, proteins.dat and all Interactome3D structures in PDB format. |